

Volume Profile for Futures Traders: POC, Value Area, HVN, and LVN Explained
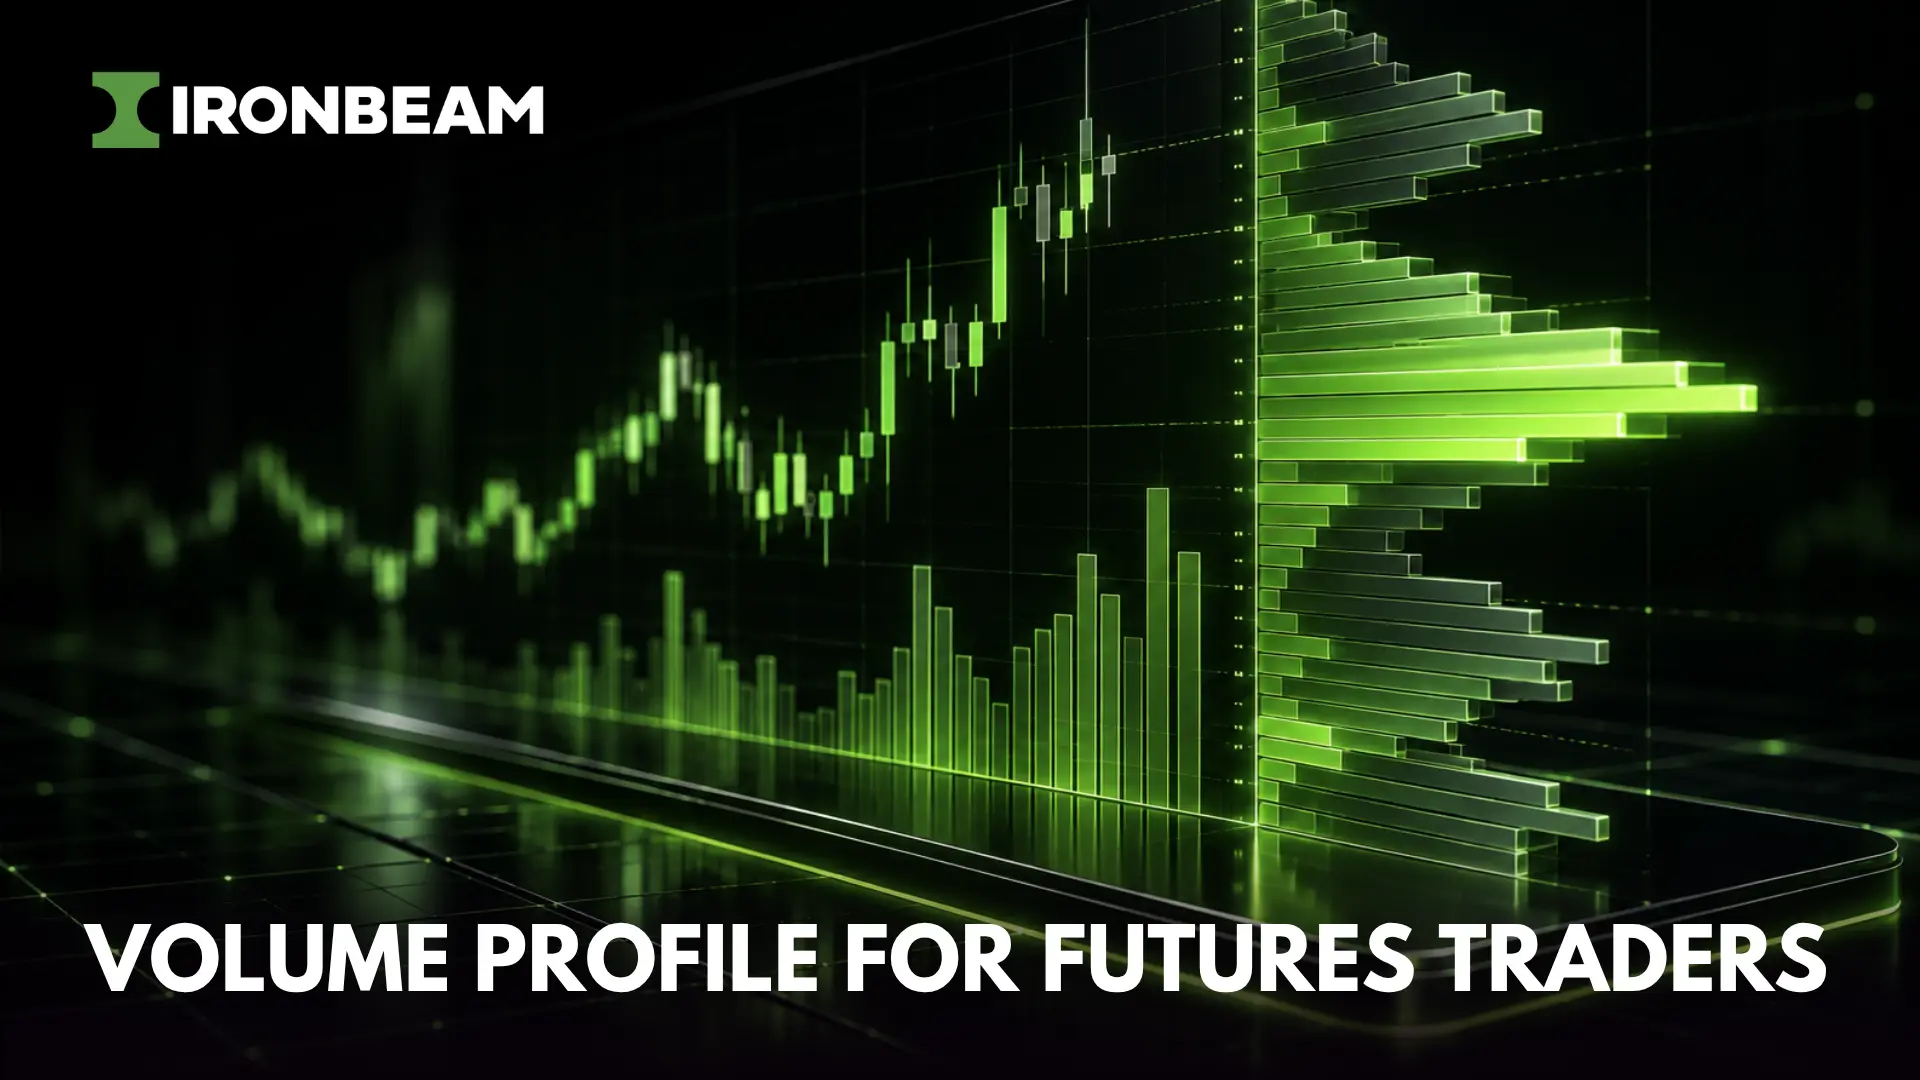
Futures volume profile plots the contracts traded at each price instead of at each time interval. The point of control marks the price with the most volume. The value area holds about 70 percent of it. High and low volume nodes show where price slows or accelerates. Traders use these levels as reference points for entries and exits.
What Is Futures Volume Profile?
Futures volume profile is a horizontal histogram that shows how many contracts traded at each price during a chosen period. It answers where trading happened, not when. Because futures trade on one central exchange book, the profile reflects the whole market, which makes its levels useful reference points for day traders.
A standard volume indicator sits under your chart and tells you how much traded in each bar. Volume profile rotates that idea. It sits beside the chart and shows where the market did its business, so you can see which prices attracted agreement and which prices the market rushed through.
It is one of the first tools to learn in order flow trading, because it needs no depth-of-market reading and works on any liquid contract such as ES, NQ, MES, and MNQ.
What Do POC, Value Area, HVN, and LVN Mean?
The point of control is the price with the most volume. The value area is the range holding about 70 percent of volume, bounded by the value area high and low. High volume nodes are peaks where price tends to slow. Low volume nodes are valleys where price tends to move quickly because little trading happened there.
| Level | What it marks | Typical price behavior |
|---|---|---|
| Point of control (POC) | Highest-volume price | Magnet, pivot, or stall point |
| Value area high (VAH) | Top of the 70% volume range | Acceptance or rejection |
| Value area low (VAL) | Bottom of the 70% volume range | Acceptance or rejection |
| High volume node (HVN) | Volume peak | Slows, consolidates |
| Low volume node (LVN) | Volume valley | Fast move or quick rejection |
Think of an HVN as a price the market agreed on and an LVN as a price it disagreed on. Price stalls where there is agreement. It accelerates where there is none.
How Is the Value Area Calculated?
Platforms start at the point of control and add the larger of the next row above or below, repeating until the included rows reach the chosen share of total volume, usually 70 percent. The top and bottom rows become the value area high and low. You can change the percentage in most platform settings.
TradingView’s support documentation lays out this step-by-step method, including how ties are broken. Calculation details vary slightly between platforms, so the same session can produce slightly different value area edges on two charts. Pick one platform for your levels and stay consistent.
How Do You Use Volume Profile Before the Open?
Mark the prior session’s point of control, value area high, and value area low before the open. Then note whether price opens inside, above, or below that value area. Inside suggests balance and rotation. Outside suggests a test of acceptance, which either holds or fails at the edge. You respond to what price does there.
Follow these steps each morning:
- Load a session profile for the most recent full trading day on the contract with the most volume.
- Mark the POC, VAH, and VAL as horizontal lines.
- Add a composite profile covering the last five to ten sessions and mark any major HVN or LVN.
- At the open, note where price sits relative to prior value.
- Wait for price to reach one of your marked levels and show a reaction before you act.
- Set your stop and position size before you enter.
Here is a hypothetical ES example with illustrative prices. Prior-day VAH is 5,100.00 and POC is 5,090.00. Price opens at 5,102.00, trades back down through the VAH, and you see the move above value fail. You wait for a retest of 5,100.00 from below, enter short on rejection, and place your stop above the failed-breakout high. The POC is your target, 40 ticks away at 0.25 per tick.
Does Volume Profile Work for Day Trading Futures?
Volume profile gives day traders objective levels, but it does not give signals. Experienced traders disagree about the point of control itself, with some fading it and others avoiding it because price can move erratically there. Test any rule on one contract in simulation before risking money. Define your stop and size before every trade.
Three setups cover most volume profile day trading. In the value area rule, price opens outside value, re-enters, and holds inside, which often leads to a move across to the opposite edge. In an LVN rejection, price reaches a thin zone, stalls, and returns to the prior HVN. In an LVN breakout, price pushes through a thin zone on strong volume and runs to the next HVN. Write down your entry, stop, and target for each, then paper trade them with the plan in place.
What Mistakes Wreck Volume Profile Trading?
Most errors come from context, not the tool. Traders profile the wrong contract during a roll, treat every node as a signal, use only one time period, or confuse margin with risk. Each mistake produces levels that look precise but reflect the wrong data or the wrong decision. Fix them first.
Rolls deserve extra care. Volume splits between the expiring and next contract in the days before expiration, and CME explains that traders watch volume in both contracts to decide when to roll. Rebuild your profile levels on the new front month once volume migrates.
A second trap is margin. A low day margin tells you what the exchange and your broker require. It does not tell you how much account equity makes a trade prudent. Read how brokers set futures margins and the margin FAQs, then size from your stop.
What Do You Need to Trade With Volume Profile?
You need a charting platform with volume profile tools and a reliable trade feed. Ironbeam, a professional futures broker, provides free CME Group Level 2 depth and supports Bookmap and Sierra Chart. Its cloud-based futures trading platform handles charting and orders without installation. Confirm current feature support for your chosen platform before subscribing.
Ironbeam offers free Level 2 market depth across CME/GLOBEX futures, including NYMEX, COMEX, and CBOT. Depth data is not required to draw a profile, but it adds context when price reaches a level. Read our guide on how to read a futures DOM.
Bookmap pairs heatmaps with volume delta and volume profile. Sierra Chart at Ironbeam suits traders who want deep chart customization with direct order routing. The Ironbeam trading platforms page compares every option, and our review of futures platforms for scalping covers speed and data for short-term traders.
Ready to trade? Open a futures account.
Frequently Asked Questions
What is volume profile in futures trading?
Volume profile shows how many contracts traded at each price over a chosen period. It appears as a horizontal histogram beside the chart and highlights the point of control, value area, and high and low volume nodes.
What is the point of control in volume profile?
The point of control is the price with the highest traded volume in the profile. Price often gravitates toward it or reacts to it as a pivot, though some traders avoid trading right at the POC because price can move erratically there.
How is the value area calculated?
Starting at the POC, the platform adds the larger neighboring row above or below until the included rows reach the chosen share of total volume, usually 70 percent. The highest and lowest included rows become the value area high and low.
What is the difference between HVN and LVN?
A high volume node is a price with heavy trading that tends to slow price. A low volume node is a price with light trading that price tends to cross quickly.
Which volume profile period works best for futures day trading?
Most day traders use the current session, the prior session, and a composite of the last five to ten sessions. Fixed range profiles help study a single move or event.
About the Author
Mike Murphy is Director of Business Development at Ironbeam, where he’s worked since 2013. He holds a Series 3 license and has spent 15+ years in financial markets, working at the intersection of futures trading and the technology that powers it. He writes about market structure, trading platforms, and what it actually takes to access futures markets efficiently.
Disclaimer: There is a substantial risk of loss in trading commodity futures and options products. Losses in excess of your initial investment may occur. Past performance is not necessarily indicative of future results. Please contact your account representative with concerns or questions. The information contained here is accurate to the best of our knowledge at the time of this writing. However, various circumstances may change over time which could affect the accuracy of the information presented. Ironbeam Inc makes no guarantees and recommends verifying details before making any decisions based on this content.