

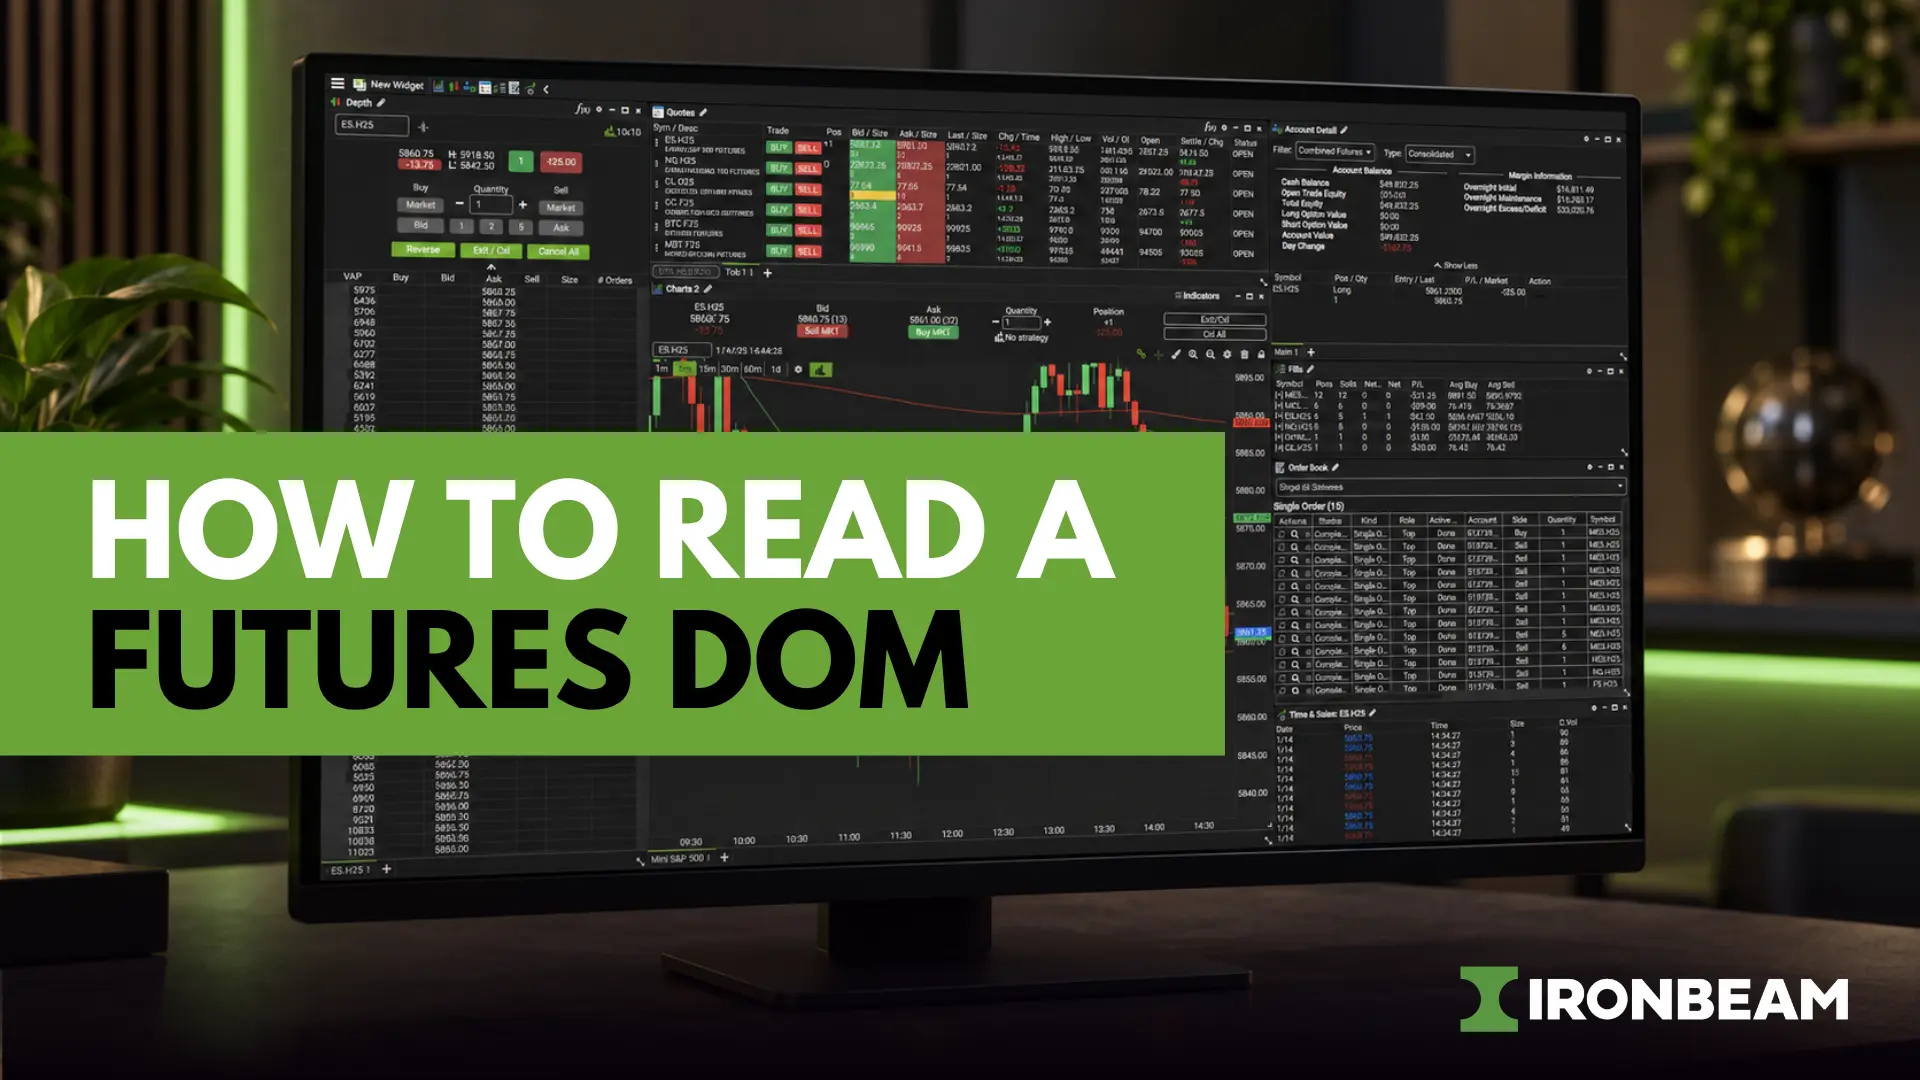
How to Read a Futures DOM: Bids, Offers, Liquidity, and Market Depth
To read a futures DOM, start at the inside market, where the best bid and best ask meet, then scan up and down the ladder for size. Resting buy orders sit below the market and resting sell orders sit above. Size shows where traders have offered liquidity. How that size behaves when price arrives tells you whether it is real.
What Is a Futures DOM?
A futures DOM, or depth of market, is a live price ladder showing the size of resting buy orders below the market and resting sell orders above it. It displays intent, not completed trades. Each number is liquidity someone has offered at that price and can cancel at any moment, which is why you read it alongside executed trades.
The DOM is the display. Level 2 data is the feed behind it. We describe Level 2 market depth as the full order book for a contract, showing multiple levels of bids and offers, the contracts available at each level, and real-time updates as orders enter or leave the book. Level 1, by contrast, shows only the best bid and ask.
The DOM is one of the core tools in order flow trading. It tells you where liquidity sits. Tools like time and sales, and footprint charts tell you what actually traded.
How Do You Read Bids, Offers, and the Spread?
The bid is the highest price a buyer will pay and the ask is the lowest price a seller will accept. The gap between them is the spread, usually one tick in liquid contracts like ES. Market buys fill at the ask and market sells fill at the bid, so every market order crosses the spread.
Picture the ladder as a column of prices. Bids stack below the current price and offers stack above. The two best prices meet in the middle. When a trader sends a market buy, it consumes size at the best ask. When size at that price runs out, the next fill happens one tick higher. That is how price moves: not by anyone setting it, but by aggressive orders exhausting the liquidity in front of them.
Spread width tells you about liquidity. A one-tick spread with deep size on both sides is a healthy market. A wider spread with thin size means each market order moves price further and fills worse.
What Does the Size at Each Level Tell You?
Size shows how many contracts are waiting at a price. Outsized size next to thin neighbors marks a level other traders visibly committed to. Size alone proves nothing, because it can be cancelled. What matters is how that size behaves when price approaches: does it absorb market orders and hold, or vanish?
Compare each level to its neighbors, not to a fixed number. In ES, a few hundred contracts at one price can be significant when the levels around it show 50 to 100. In a thinner contract, the same figure would be enormous. Learn what normal looks like in the contract you trade, then watch for departures from it.
Standard depth displays aggregate orders at each price. If you want to see individual orders in the queue, that is a different data type, explained in our guide to MBO and MBP.
What Are Absorption, Pulling, Stacking, and Reloading?
Absorption is size that holds and refills while market orders hit it. Pulling is size cancelling as price approaches. Stacking is size being added at a level. Reloading is the same size reappearing after partial fills, a possible sign of an iceberg order. Each behavior says more about intent than the number on the ladder does.
Here is how each looks in practice:
- Absorption. Sellers hit a large bid again and again. The bid shrinks, then refills, and price barely moves.
- Pulling. A large bid sits below price. As price gets close, it disappears. The level was decoration.
- Stacking. Size builds at a price as it approaches, which can signal growing interest.
- Reloading. A level is consumed, then the same size appears again. That suggests a larger hidden order behind the visible portion.
Can You Trust the Orders You See on a DOM?
Not always. Resting orders can be cancelled instantly, and some participants post size they never intend to trade. CME Rule 575 prohibits entering orders with the intent to cancel them before execution, but you should still treat displayed size as evidence, not proof. Confirm with executed trades before you act on any level.
CME’s own education material states that Rule 575, Disruptive Practices Prohibited bars bidding or offering with the intent to cancel before execution, and that all orders must be entered to execute bona fide transactions. The rule exists because a misleading picture of depth can move price. You can’t see intent, so protect yourself by waiting for trades to confirm what the ladder implies.
How Do You Trade From the DOM?
Use the DOM to time entries at levels you already marked, not to find them. Wait for price to reach the level, watch how resting size behaves, and confirm with executed trades. Enter with a stop and target, and size from your stop. Placing orders by clicking the ladder is fast, so check the price and quantity before every click.
Here is a hypothetical ES example with illustrative numbers. Your prior-day value area low, from [LINK: volume profile post], is 5,090.00. Price falls toward it. The DOM shows 450 contracts bid at 5,090.00, against 60 to 90 on neighboring levels. Price touches the level and sellers hit the bid. Size drops to 120, then refills toward 400. Time and sales show heavy selling at that price, yet price holds for three ticks.
That is absorption at a level you chose in advance. You buy at 5,090.25 and place a stop at 5,089.00, five ticks away. That risks $62.50 per ES contract or $6.25 per MES contract, since a tick is worth $12.50 in ES and $1.25 in MES. If instead the 450 bid had vanished as price arrived, you would skip the trade.
Follow these steps each time:
- Mark your level before price gets there.
- Orient the ladder and find the inside market.
- Scan for size that stands out against its neighbors.
- Watch how that size behaves as price arrives.
- Confirm with executed trades on the tape.
- Enter with a stop and target, then size from the stop.
Margin does not set your risk here. The Ironbeam day margins table shows what you post to hold a position, and our guide to how brokers set futures margins explains why that number changes. Your stop distance and account size decide what you can lose. Test any DOM approach in simulation before risking money.
What Do You Need to Trade With a DOM?
You need real-time Level 2 data and a platform with a DOM. Ironbeam, a professional futures broker, provides free Level 2 depth on its cloud-based futures trading platform through the Depth widget, with order entry from the ladder. Customize the layout with volume columns and working orders. Confirm current data coverage on the contracts you trade.
Ironbeam’s free Level 2 data covers CME/GLOBEX futures, including NYMEX, COMEX, and CBOT. On the Ironbeam platform you open the Depth widget, watch the book update in real time, and place orders by clicking price levels on the DOM.
If you want to see how liquidity changes over time rather than as a single snapshot, Bookmap displays market liquidity as a heatmap. Sierra Chart at Ironbeam offers another option for traders who want deep chart customization and direct order routing. Compare every option on the Ironbeam trading platforms page, or read our review of futures platforms for scalping if you trade fast. When you’re ready, open a futures account.
Frequently Asked Questions
What is a DOM in futures trading?
A DOM, or depth of market, is a live price ladder that shows resting buy and sell orders at each price. Bids sit below the market, offers sit above, and the size at each level shows how much liquidity is waiting.
Is the DOM the same as Level 2?
They are closely related. Level 2 is the market depth data feed. The DOM is the ladder display that presents that data so you can read it and often place orders from it.
Can you trust large orders on the DOM?
Treat them as evidence, not proof. Resting orders can be cancelled at any time, and CME Rule 575 prohibits entering orders with the intent to cancel them before execution. Confirm with executed trades before acting.
How do you place orders from the DOM?
On the Ironbeam platform, you open the Depth widget and click price levels on the ladder to place orders. Check the price and quantity before each click, since the process is fast.
What is the difference between the DOM and time and sales?
The DOM shows resting orders that have not traded yet. Time and sales shows executed trades in sequence. Reading both together shows whether the size you see on the ladder is actually trading.
About the Author
Mike Murphy is Director of Business Development at Ironbeam, where he’s worked since 2013. He holds a Series 3 license and has spent 15+ years in financial markets, working at the intersection of futures trading and the technology that powers it. He writes about market structure, trading platforms, and what it actually takes to access futures markets efficiently.
Disclaimer: There is a substantial risk of loss in trading commodity futures and options products. Losses in excess of your initial investment may occur. Past performance is not necessarily indicative of future results. Please contact your account representative with concerns or questions. The information contained here is accurate to the best of our knowledge at the time of this writing. However, various circumstances may change over time which could affect the accuracy of the information presented. Ironbeam Inc makes no guarantees and recommends verifying details before making any decisions based on this content.