Hi,
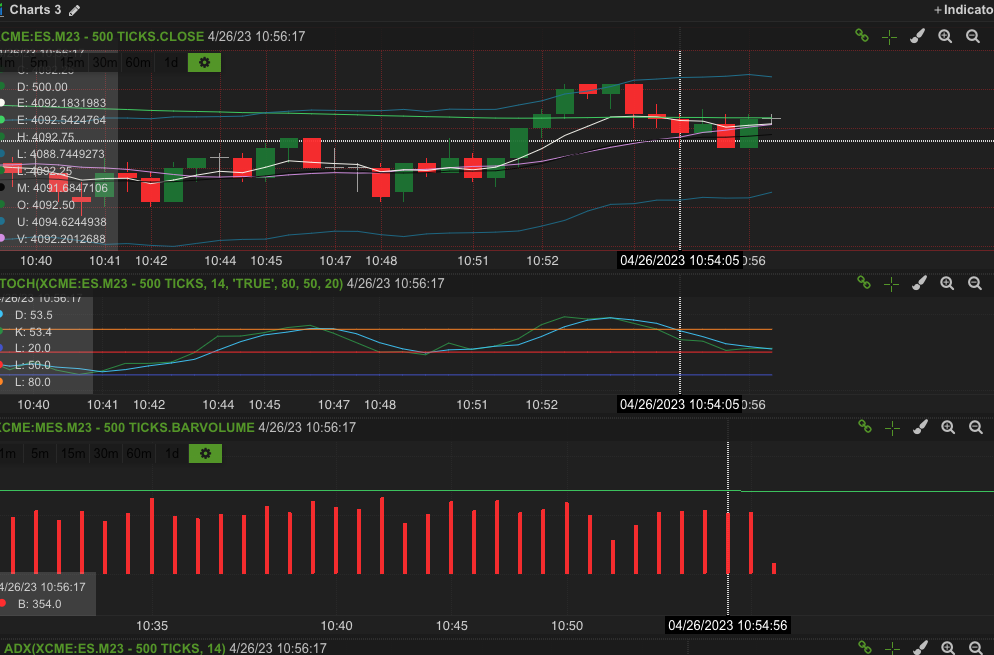
I have noticed that when using tick charts, the candles and volume bars don’t line up with the same timeframes. Is there a way to solve this or is it something that happens when using tick charts? It seems using a 1-min chart does not have the same issue and that candles and volume bars are aligned.
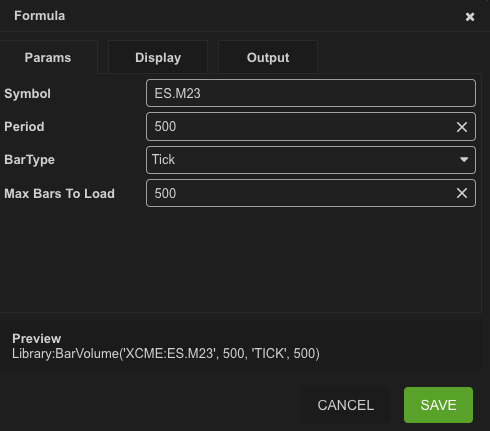
More specifically, it looks like the cursor line does not line up. The actual volume bars MAY correlate to the candle but I can’t tell bc the cursor vertical line doesn’t seem to align with both candle and volume bar all the time when using tick charts as shown in the pic. Note that the volume chart setting matches 500 ticks which displays in the image I posted. I also sent you a separate snip of the image.
I’ll look at it further, but it must be some type of issue I am having with the windowing. I will try to post a video describing the issue. It seems that the cursor travels in larger jumps than the bar chart portion. Will see what I can upload.
Thanks agian!
1 Like
DISCLAIMER: There is a substantial risk of loss in trading commodity futures and options products. Past performance is not necessarily indicative of future results.